Search This Blog

Friday, July 21, 2023

Grafana Dashboard Automation Framework using Postman scripting with JavaScript


API automation is the most important and very frequently done task in the industry. Postman is the tool that most companies are using for manual testing of the APIs. Because of the simplicity, can arrange and do well-organized and collaborative work within the same workspace.

Here I'm explaining one of the big problems I faced and how I got solutions through Postman the best feature of the scripting facility and the collection run tool of Newman. I resolved my problem very clearly more than my lead expected from me and through the Postman scripting.

There consists of a major monitoring platform including Prometheus and Grafana tools used to visualize the whole product and the deployment platform health checks. The content of deployments was on the Kubernetes environment where the  Prometheus and Grafana were deployed as it’s pods. There were more than 30 Dashboards on the Grafana and it was a time-consuming task to check the dashboard with the release timeline manually. So the task was to automate the data propagation to the Grafana through the Prometheus. Then, as a solution for the automation used the Postman Scripting.

I used the Prometheus API tool kit and promQL to get the data published to Grafana dashboards. PromQL refers to the query language that is used by Grafana to get the relevant data from Prometheus.  I have attached a response I have below.


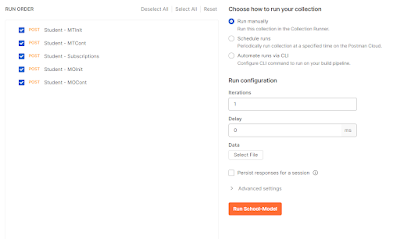
There are the most commonly used assertions and codes provided by Postman. So it's very easy and funny to start the scripting itself. If you going to automate a huge response you must have some sort of javascript skill to manage it. You can manage and run API requests folder-wise or collection-wise. But there exists a limitation when executing as a collection-wise run.  The Newman was used to overcome the above-mentioned limitation.

jsoncrack is the tool that I used for capturing the correct parameter and the value from the huge response.

Then I used the Newman tool to run my completed API automation collection.

Installing Newman:

1. Install nodejs package
2. Install Newman
npm install newman

Postman collection run command:

newman run [collection-name].postman_collection.json -e [environment].postman_environment.json

If you need to run with ignoring or disabling SSL:

newman run Grafana-Promethus-Automation.postman_collection.json -e Prometheus-Env.postman_environment.json --insecure

The followings are the result I got once I ran the Postman collection by Newman.

I have used the tool nodejs htmlextra report below to illustrate the results of the execution of the automation framework. 


Conclusion:
Postman and Newman can be used for a number of test cases, including creating usage scenarios, Suites, and Packs for your API Test Cases. Further Newman can integrate with CI/CD Tools very easily.

JMeter Distributed Environment Setup with Docker


1. Install docker and docker-compose on your server - https://docs.docker.com/engine/install/ubuntu/

curl -fsSL https://get.docker.com -o get-docker.sh sudo sh ./get-docker.sh --dry-run
curl -fsSL https://get.docker.com -o get-docker.sh sudo sh get-docker.sh

2. Create a directory structure as follows,

jmeter[main directory] ->[sub directories]jmeter-base, jmeter-master, jmeter-slave, temp, script

3. Create docker-compose.yml, start-jmeter.sh, and start-jmeter.sh files inside the jmeter main directory.

4. Start the docker-compose

docker-compose up If something happened in the midle, you can run follows docker-compose up --build

5. Disable the 'server.rmi.ssl' to ignore the ssl verification on jmeter.properties file in the master and slave node/s

uncomment the #server.rmi.ssl.disable=false and enable it server.rmi.ssl.disable=true

6. Run the start-jmeter.sh file as follows

sudo sh start-jmeter.sh

7. Login to the jmeter_slave docker and start using the following command

./jmeter-server

8. Copy the performance test jmx file to the master container

9. Start the jmx from the master container as follows,

[jmeter_master_home/bin] nohup jmeter -n -t /scripts/[script_name].jmx -R [slave_IP/s] &

Converting Postman Collection to the K6 Script

 K6 is a fast performance tool now in the current software industry to test the performance test on a system. K6 is developed under the Go language it's supported to script in Javascript.

Here I'm trying to create a Postman collection and convert the collection to a k6 script only using execution 2, 3 command whole to generate a performance script too. It's too easy and too fast to execute. K6 finally gives a descriptive summarization of the performance test as well. Following my hands-on practical.

1. Create a Postman collection with all API or API operations and tryout with the execution 'Run as Collection' option by Postman itself.


2. Export postman collection and the environment variables as a json

3. Install Postman to k6 nodejs model using the following command

npm install -g @apideck/postman-to-k6

4. Generate k6 script via using the following command

postman-to-k6 [postmand-collection].json -e [postman-environment].json -o [script-name].js

5. Generated k6 script as follows

6. Run the k6 script with using 'k6 run [script_name]'

References - https://k6.io/blog/load-testing-with-postman-collections/

JMeter Distributed Performance Test in Linux Environment

 Without SSL do the performance test

Master and Slave servers configurations:- Key points to keep attention:  - Same JMeter version used by master and slave servers  - Same java JDK installed Change the jmeter.properties file as follows in master remote_hosts=172.x.x.x
Uncomment 'server.rmi.ssl.disable' and set it as true as follows( by default it mention as false and commented) in both master and slave nodes.
Start slave node 'jmeter-server' file as follows [./jmeter-server]
Start master jmeter script as follows with nohup
With SSL do the performance test Generate rmi_keystore.jks key as follows and keep the following point for that. name: rmi & password: changeit
Copy the 'rmi_keystore.jks' file to the slave /bin folder Change jmeter.properties file as follows in master
Start slave node jmeter-server file as follows [./jmeter-server -Djava.rmi.server.hostname=172.xx.x.x]
Start master jmeter script as follows with nohup
Observed errors and solutions:- When the slave starting mode went wrong If you started the slave node as follows, you will observe the following attached master node error. [./jmeter-server]
So you should start as follows the slave node [./jmeter-server -Djava.rmi.server.hostname=172.xx.x.x] 2. You can observe the following error response when mismatch of the 'rmi_keystore.jks' file password. So 'server.rmi.ssl.keystore.password' password and 'rmi_keystore.jks' file generation the password should be the same.

Thursday, July 20, 2023

Welcome to My Pages !

Welcome to My Pages!

My automation experiences 👉👉👉👉

  • JavaScript - Important
  • JMeter Distributed Performance Test in Linux Environment
  • Conversion of Postman Collection to the K6 Script
  • JMeter Distributed Environment Setup with Docker
  • Postman Scripting and Newman collection execution

Unlock Web Testing Excellence: Comprehensive Cypress Cheat Sheet !

  Unlock the Full Potential of Cypress with Our Comprehensive Cheat Sheet! Welcome to my blog!   If you're a QA engineer or a test autom...

Most popular